|
|
7 eigenperiods (in sec): [9.504, 3.215, 1.987, 1.485, 1.228, 1.087, 1.016]
7 eigenfrequencies (in Hz = cycles per sec): [ .105, .311, .503, .674, .814,
.920, .985]
The clock running in this video is almost synchronized with the real time
elapsing.
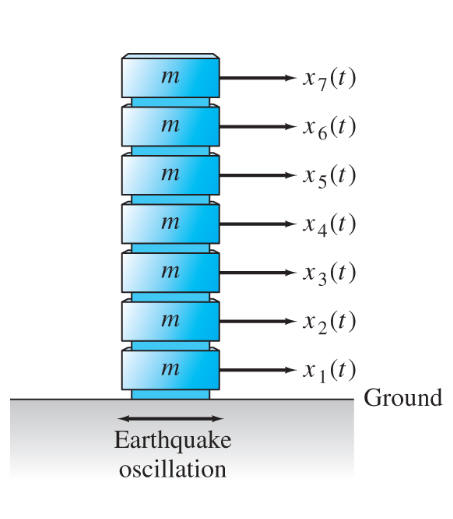
7 story building profile horizontally shaken by earthquake, slowest to
fastest mode (longest to shortest period) : left to right
[In the right view, each broken line segment is the profile of the building at
maximum amplitude of the natural oscillation, while the left view is the
corresponding animation for t = 0..10, about one period of the slowest
mode.]
Unfortunately the animated GIF output from Maple does not show enough frames of
the fastest mode 7 to make it look like a continuous oscillation, but its
frequency is 10 times the slowest mode so the time scales are too far apart to
do justice to both simultaneously without more sophisticated graphics handling.
Notice that the mode number is exactly the number of monotonically increasing or
decreasing intervals of the horizontal displacement function as a function of
the height. Who would have ever discovered this feature without technology being
able to deliver this ordered sequence of normal model profiles? Of course it
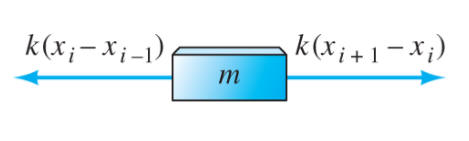
also makes perfect sense. The more adjacent springs oppose each other by
oscillating 180 degrees out of phase, the bigger the deviations from equilibrium
and the stronger the Hooke's law forces, and for an oscillation, stronger forces
mean larger frequency.
For a good reference see Henri Gavin and John Dolbow, Civil and Environmental Engr., Duke University, Durham, NC:
see especially: Vibrations in Multiple-Story
Buildings [real vibration
modes]
Notice all the stuff from our chapters 5, 6 and 7 of Edwards and Penney DE
and LinAlg that you already should
recognize or soon should:
Hooke's law, damping, free response damped oscillations, natural frequency,
sinusoidal driving functions, amplitude, phase shift, resonance, resonance
peaks in amplitude versus frequency plot, phase-shift passing through 180
degrees
at resonance, beating, eigenvectors, eigenvalues, coupled linear
differential equations
These URL's appear near the beginning of this list of earthquake modeling references:
Some local Maple worksheets for the 7 story (or less) earthquake project: